
Table of Contents:
Introduction to Bollinger Bands Trading
Tap into the power of technical analysis with Bollinger Bands Trading. For beginners and seasoned traders alike, this strategy is an essential tool in understanding market volatility, and more importantly, in capturing profits. Created by John Bollinger in the ‘80s, these bands have now become one of the most popular technical analysis tools. They work by providing a relative definition of whether prices are high or low and therefore, give traders invaluable insights and the potential to squeeze out impressive profits. In this article, we will delve deep into the core attributes and uses of Bollinger Bands while facilitating an easy understanding for everyone.
Understanding Bollinger Bands
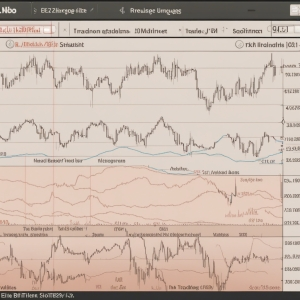
The Bollinger Bands are a technical analysis tool that involves three lines – a simple moving average (middle band), and two standard deviation lines (upper band and lower band) plotted above and below the average. The simple moving average usually encompasses a 20-day period. The less common but equally valid approach is using a 10-day period for shorter term trading.
The distance between the upper and lower bands reflect the level of volatility in the market. A wide gap implies high volatility, whereas a narrow gap signifies low volatility. The position of the price relative to the bands can also indicate overbought or oversold conditions.
Understanding these bands can equip traders with the insights needed to make timely and profitable decisions. Whether you're a day trader or a long-term investor, interpreting the Bollinger Bands can provide a valuable perspective on the behavior of market prices.
Pros and Cons of Bollinger Bands Strategy
| Pros | Cons |
|---|---|
| Allows traders to gauge volatility | Does not guarantee success in volatile markets |
| Can provide sound buy and sell signals | Might provide false signals in sideways markets |
| Useful in identifying trend reversals | Demand for constant monitoring and quick responsiveness |
| Can be combined with other strategies | Requires significant trading experience for effective use |
How the Bollinger Bands Strategy Works

Now that you have an understanding of what Bollinger Bands are, it's time to explore how the Bollinger Bands strategy works in the trading world. The approach is mostly based on the idea of mean reversion, implying that the price often tends to return to its average value over time.
The trading begins when price 'touches' the upper band. This touch generally indicates a strong market, and traders may consider shorting at this point in anticipation of the reversal towards the mean. Conversely, if the price touches the lower band, the market might be considered weak, with the potential to reverse and rise towards the mean or the middle band. These conditions are often termed as overbought or oversold, respectively.
However, it's critical to understand that not every touch of the bands leads to a reversal. During a strong trend, prices may run along the upper or lower band, indicating strong momentum. To enhance the chances of profitable trading, other strategies and indicators like the Relative Strength Index (RSI) can be used in conjunction with Bollinger Bands.
The Bollinger Bands strategy can prove incredibly useful throughout different market conditions. Whether it's helping to identify potential buy and sell opportunities, spotting reversals, or grasping volatility, the Bollinger Bands strategy plays a pivotal role.
Using Bollinger Bands for Profitable Trading
A key element in making Bollinger Bands trading profitable is the concept of the squeeze. The squeeze occurs when the bands are at their narrowest, indicating lower volatility. This situation often precedes a sudden increase in volatility leading to significant price movements. Traders can potentially profit by anticipating these movements and adjusting their positions accordingly.
Another useful technique with Bollinger Bands is the identification of W-Bottoms and M-Tops. These patterns can signal changes in the trend, enabling traders to buy or sell before the price begins its new direction. A M-Top, for instance, appears when the price rises to touch the upper band twice with a decline in between, then breaks down below the support level. Conversely, a W-Bottom forms when the price marks a low close to the lower band, bounces back, forms another low near the previous one, and finally starts an upward rally.
A successful Bollinger Bands strategy also involves incorporating other technical indicators. For instance, using the Relative Strength Index (RSI) or Moving Average Convergence Divergence (MACD) can provide additional confirmation of reversals or continuations.
Finally, remember that the effectiveness of the Bollinger Bands, as with any trading tool, largely depends upon the trader's understanding of the financial markets, their risk tolerance, and their trading discipline.
Reducing Risk with Bollinger Bands
One of the standout features of Bollinger Bands trading is its potential in risk management. In the unpredictable sphere of trading, the risks can be substantial, and the ability to manage this risk can be the determinant between a successful and an unsuccessful trader.
The Bollinger Bands provide a clear visual representation of the price range within which a given asset is trading. It indicates when and to what extent the price is deviating from its average — signalling possible reversals. This allows traders to set stop losses closer to the actual price action while giving a good measure of the volatility risk involved.
The upper and lower outlier movements of market prices could be identified as potential risk. While touching the upper band may indicate that the asset is overbought and prices may fall, touching the lower band may indicate that the asset is oversold and prices may rise. By following these signals, traders can take suitable measures to protect their stakes in volatile market phases.
Furthermore, the "Bollinger Squeeze" can warn of incoming volatility surges, giving a trader precious time to adjust positions and brace for market movements. In a nutshell, a thorough understanding and conscious use of Bollinger Bands can potentially reduce risk and add stability to a trading strategy.
Keep in mind, however, that while Bollinger Bands can assist in making informed decisions, they should not be used in isolation. Intelligent use of other complementary technical analysis tools and indicators along with the Bands is vital for a rounded and vigilant risk-averse approach.
Real-World Examples of Bollinger Bands Trading
Actual trading scenarios can help provide a better understanding of how the Bollinger Bands strategy works. Let's consider a few examples:
1. Trend Identification: Traders often use Bollinger Bands to identify the start or end of a trend. For instance, when the price that was previously touching the upper band begins to dip below the middle band, it might signify a downward trend. Conversely, a price shift from the lower to above the middle band may suggest an upward trend.
2. Trend Continuation: During a robust trend, prices tend to hover close to the outer bands. For example, in a strong uptrend, prices might follow the upper band, and in a downtrend, they may cling to the lower band. Even brief excursions towards the middle band wouldn’t necessarily mean the trend has ended but simply that the trend is taking a breather.
3. Overbought and Oversold Signals: Bollinger Bands can help identify instances where the asset is overbought (when prices are closer to the upper band) or oversold (when prices are closer to the lower band). However, these signals are not foolproof, and prices can remain overbought or oversold for extended periods during a strong trend. So, these signals are often used in conjunction with other indicators.
Remember, while Bollinger Bands are powerful tools, they should not be used in isolation, and all trading strategies should be used judiciously and in conjunction with a disciplined risk management approach.
Conclusion: Maximizing Profits with Bollinger Bands

Trading in the financial markets is not just about buying low and selling high. It's also about understanding the underlying mechanisms that dictate these price fluctuations. Bollinger Bands trading provides an effective way to comprehend these dynamics and to forecast potential price movements. The strategic use of Bollinger Bands can help traders to maximize profits and reduce losses by predicting significant price deviations known as 'squeezes'.
Furthermore, the Bollinger Bands strategy offers versatility in a wide variety of market conditions. Its use extends beyond just identifying overbought and oversold conditions. unique patterns such as 'W-Bottoms' or 'M-Tops', for instance, can offer crucial insights into trend reversals.
However, it's important to remember that, like any other tool, Bollinger Bands are not fool-proof. They should be used in conjunction with other analytical tools and not in isolation. Combining Bollinger Bands with other technical indicators such as the RSI or MACD, can provide valuable safeguards against false signals and protect the traders' investments.
Ultimately, successful trading with Bollinger Bands or any other tool comes down to a comprehensive market understanding, adequate risk management, and discipline. So before venturing out into the dynamic world of trading, equip yourself with the necessary knowledge, develop a well-thought-out trading plan and be ready to adapt to rapidly changing market conditions.
Frequently Asked Questions about Bollinger Bands Strategy
What is the Bollinger Bands Strategy?
Bollinger Bands Strategy is a technical analysis method which designates upper and lower trading bands and a moving average. It helps traders understand the highs and lows of a security's price relative to previous trades.
How does Bollinger Bands Strategy work?
The Bollinger Bands strategy works on statistical chart characterizing the prices and volatility over time of a financial instrument. The strategy's three main components, the upper band, lower band, and middle band help in determining the volatility and price levels.
Who developed the Bollinger Bands Strategy?
The Bollinger Bands strategy was developed by John Bollinger, a renowned technical trader, in the 1980s. The method has since been widely adopted by traders worldwide.
What is "squeezing out profits" in context of the Bollinger Bands Strategy?
"Squeezing out profits" refers to the strategy used when the bands come together, indicating decreased volatility. Traders use this as an opportunity to prepare for a breakout, with the prospect of securing profits.
How reliable is the Bollinger Bands Strategy?
The Bollinger Band strategy, like any other tool used in technical analysis, isn't foolproof. Its effectiveness ultimately depends on its application and interpretation by the trader.