
Table of Contents:
Introduction to The Power of Trendlines
Do you ever wonder how traders predict market movements and make investment decisions? The secret often lies in the power of Trendline Analysis. Trendline Analysis, an essential tool in the world of financial trading, helps in charting the course of markets.
For beginners in the crypto and financial realm, understanding how to use this tool can provide significant advantages. This guide aims to demystify the use of trendlines in trading. You will discover their basic concepts, their importance in financial forecasting, and how to draw and interpret them in your trading journey.
Armed with this knowledge, you'll be better placed to confidently navigate the often turbulent ocean of financial markets. So, even if you're a newbie, don't worry; this guide will break down the complex world of Trendline Analysis into digestible and understandable chunks. Let's dive in.
Understanding Trendline Analysis
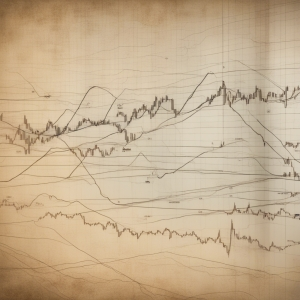
Trendline Analysis is fundamental in tracking both uptrends and downtrends in the financial markets. It's a form of technical analysis based on the premise that market prices move in trends. At its core, a trendline is a line drawn over pivot highs or under pivot lows to showcase the prevailing direction of price. They help visualize the market's movement, identify potential reversals, and highlight zones of support and resistance.
Typically, trendlines are drawn to mark uptrends and downtrends over charted market pricing data. An uptrend is indicated by drawing a line under swing lows, which form increasing levels of support. On the other hand, a downtrend is depicted by a line drawn over swing highs that provide levels of resistance.
Reliable trendlines should connect at least two swing highs or lows, but the more points it touches, the stronger it becomes. However, it's important to remember that no matter the trendline's strength, its breakage could signify a market reversal.
By using Trendline Analysis, traders can expect to gain insights into market trends and gauge the probable direction of price movement. This renders it as a crucial tool worthy of a spot on every investor's toolkit.
Pros and Cons of Using Trendlines in Market Charting
| Pros | Cons |
|---|---|
| Visual representation of market trends | May oversimplify complex market conditions |
| Helps in spotting possible reversals | Potential for false alarms |
| Useful for setting stop losses and take profits | Reliance on subjective judgment |
| Valid across multiple time frames | Requires substantial experience to use effectively |
How Does Trendline Analysis Work?

In Trendline Analysis, the first step is to identify the general trend direction of the market. Is it going up, down or moving sideways?
In an uptrending market, you draw a line below the ascending lows. Conversely, in a downtrending market, you draw a line above the descending highs. Essentially, these trendlines serve as visual representations of support and resistance levels in a market trend.
It’s important that the trendline connects at least two price points. Often, the more price points a line connects, the stronger the trendline can be considered. This implies that if the price breaks through this line, the trend could be in the process of reversing, a critical piece of information for traders.
Moreover, the validity of a trendline is based on two major considerations. One: the more times a trendline has been touched or approached by price level, the more significant it becomes. And two: the longer the timeframe, the more accurate the trendline. Thus, trendlines drawn on weekly or daily charts are typically more reliable than those drawn on hourly or four-hour charts.
Lastly, combining trendline analysis with other technical analysis tools can improve prediction accuracy and help ensure successful trading strategies. For example, indicators such as moving averages or the Relative Strength Index (RSI) can provide additional confirmation signals, reinforcing your overall trading strategy.
The Significance of Upward and Downward Trendlines
So, how do upward and downward trendlines in your Trendline Analysis chart affect your trading decisions? Well, the answer lies in how these trendlines signify different market sentiments.
An upward trendline, characterized by higher highs and higher lows, indicates a bullish market. In simpler terms, the overall sentiment of the market is positive, with prices expected to continue rising over time. This signifies a buying opportunity for traders as they anticipate further price increases.
On the flip side, a downward trendline, marked by lower highs and lower lows, suggests a bearish market. Here, the overall market sentiment is negative, and prices are anticipated to drop further. For traders, this presents a potential selling opportunity to capitalize on the declining prices.
Being able to comprehend the significance of these trendlines empowers you to make more informed decisions in trading. With a proper understanding of Trendline Analysis and careful attention to the shifting patterns, you could seize opportunities at the right time and possibly reap significant rewards.
Remember, in the world of trading, knowledge is power. The more skilled you become in interpreting trendlines, the better positioned you are to leverage their predictive capabilities to your advantage.
Critical Elements in Analyzing Trendline Patterns

Mastering Trendline Analysis goes beyond understanding upward and downward trendlines. It entails recognizing and interpreting critical elements within trendline patterns, which significantly influence trading decisions. Let's discuss some of these essential elements.
Existence of multiple trendlines: Sometimes, instead of a single trendline, a market might exhibit multiple trendlines - a pattern known as a trend channel. A trend channel consists of two parallel trendlines: an original line drawn along the swing highs (downward channel) or swing lows (upward channel) and a parallel line, creating a raised or lowered corridor that neatly encapsulates the price action.
Relevance of trendline slope: The angle of a trendline, or its slope, can hint towards the strength of the underlying trend. A steep trendline may indicate rapid price change but could be unsustainable over the long term and prone to rapid reversals. Conversely, a gentle slope might signify a more sustainable, albeit slower-moving trend.
The breakage of a trendline: It is key to note when a price breaks through the trendline as it often signals a trend reversal, paving the way for a potential exit or entry point in trading. However, not all breakages lead to trend reversals. Sometimes, it could be a 'false break', followed by the price returning to the trend. The key is to look for a confirmation after the break, like an increase in volume or a candlestick closing beyond the trendline.
Adjusting your trendlines: Charting the trendlines is not a one-time act. Traders should be flexible and adjust the lines when the price departs from the original trend. Adaptability is indeed an essential aspect in Trendline Analysis.
To sum up, by understanding these critical elements and skillfully applying them in analysis, traders can enhance their ability to forecast market trends and make informed trading decisions. Remember, the art and science of Trendline Analysis is centered around practical application, consistent practice, and continuous learning.
Advantages of Using Trendline Analysis in Cryptocurrency Trading
Cryptocurrency markets, famous for their volatility, necessitate the use of effective tools and techniques to predict future price direction. Trendline Analysis stands out as one of the most proficient methods in this respect. So, what are the benefits of using Trendline Analysis in cryptocurrency trading?
Firstly, Trendline Analysis provides a visual representation of the market's sentiment, making it easier to comprehend the market's behaviour. This removes much of the guesswork and provides a clear-cut picture of price directions.
Secondly, Trendline Analysis equips traders with the ability to identify changes in trends. Spotting a trend reversal at the earliest stage can provide lucrative trading opportunities, offering a competitive edge to the traders employing this tool.
Thirdly, using Trendline Analysis, traders can determine entry and exit points more accurately. Recognizing the points at which the currency is most likely to rebound provides an optimal point of entry, whereas noting where the trend is weakening can guide the selling decisions.
Lastly, combining Trendline Analysis with other technical analysis techniques can help build a robust trading strategy. By confirming the insights provided by Trendline Analysis with other indicators, traders can improve the precision of their trading decisions.
In conclusion, Trendline Analysis delivers a wealth of benefits for cryptocurrency traders. It assists in understanding market direction, identifies potential reversal points, aids in decision-making and significantly improves trading strategies. As such, it's an indispensable tool for crypto trading success.
Understanding the Risks with Trendline Analysis
Trendline Analysis, like any investment tool, is not without its risks. It's essential to understand these potential pitfalls to use this tool effectively. The first risk to consider is that while trendlines can help identify trends, they don't predict the future. Market movements are influenced by a plethora of factors, and a trendline only provides a guide based on past price behavior. Therefore, relying solely on trendline analysis can potentially lead a trader into traps.
The second risk is the subjectivity involved in drawing trendlines. Different traders might draw different trendlines for the same set of data. This could lead to confusion and contrasting interpretations of market trends.
The third risk is associated with the violation of trendlines. A significant caveat for traders is that a trendline break does not always signal a trend reversal. There can be false breakouts, where the price appears to break a trendline but then continues the original trend. Going into a trade purely based on a trendline break can be risky and destabilizing.
Lastly, trendlines tend to work best in highly liquid markets with high volumes of trading. In less liquid markets with lower trade volume, price movements can become erratic and less predictable, making trendline analysis less reliable.
Understanding these risks is essential for anyone planning to employ trendline analysis as part of their trading strategy. But even with its inherent risks, when used judiciously and complemented with other technical analysis tools, trendline analysis can be a powerful tool to make sense of market trends and directions.
Key Takeaways – The Power of Trendlines in Market Analysis
By now, you understand that Trendline Analysis is not merely drawing lines on a chart; it's a strategic technique that can illuminate the direction of the market. Here are the key takeaways on the power of trendlines in market analysis:
1. Visualization of Market Trends: Trendlines help you visualize the primary trend of a market, making the recognition of an uptrend, downtrend, or sideways market far less complicated.
2. Identifying Support and Resistance Levels: Trendlines serve as clear indicators for support and resistance levels. These are price points within the market where persistent buying or selling often occurs.
3. Predicting Potential Breakouts and Reversals: When a price breaks a trendline, it may signify a possible market reversal. This knowledge can significantly aid your decision-making process during trading.
4. Aiding Risk Management: Implementing trendline analysis can improve your risk management strategy. For instance, creating stop-loss orders at points near a trendline can minimize losses in case of a trendline break.
5. Enhances Your Overall Trading Strategy: Lastly, trendline analysis is best used in conjunction with other technical analysis tools. This synergy can help confirm trading signals, thus enhancing your overall trading strategy.
In summary, the power of trendlines in market analysis lies in their ability to simplify complex market behaviour into a understandable visual format. Through trendline analysis, you can unveil potentials and risks in your trading journey, raising your trading game to new heights.
Navigating the Markets: The Essential Guide to Trendlines
What is a trendline in market charting?
A trendline is a line drawn over pivot highs or under pivot lows to show the prevailing direction of price. Trendlines are a visual representation of support and resistance in any time frame.
How do you draw a trendline?
To draw a trendline, you need at least two significant highs or lows on the chart. Draw a straight line that connects these points. The line can either be extended to the right to provide a guide for future price action.
What is the significance of a trendline in chart analysis?
A trendline helps traders identify market trends, understand market patterns, predict potential reversals, and set stop-loss levels. A trendline break can signal a significant potential change in market sentiment.
What does it mean when a trendline is broken?
When a trendline is broken, it may indicate a potential reversal in the market trend. Traders use this as a signal to enter or exit positions. This, however, depends on other technical indicators and market context.
How accurate are trendlines?
Trendlines are not 100% accurate and should not be used alone to make trading decisions. They are best used in conjunction with other technical analysis tools. The relevance of a trendline becomes higher with more frequent touches without breaking.